See what your competitors actually sell
You just give us a shop's address. Every few hours we read its stock levels, and from the drops we work out how many units it sold and at what price. No plugins and no access to their admin panel: all of it comes from what the shop publishes itself.
- Free: we show you that we can read this shop
- The whole catalogue, with stock for every variant
- Read as often as every 2 hours
- Exact unit counts wherever the shop publishes them

SKUmio in numbers
- 351
- e-commerce platforms we can read stock levels from
- 28M
- shops worldwide run on platforms we already support
- 60 s
- to find out if we can monitor your competitor's shop
- 0
- plugins to install, on your side or the competitor's
How much your competitor sold, and what is on their shelves
Competitors' exact sales, worked out from the drops in their stock levels. Every product with its price and stock history. Plus a view of their marketing and their social media.
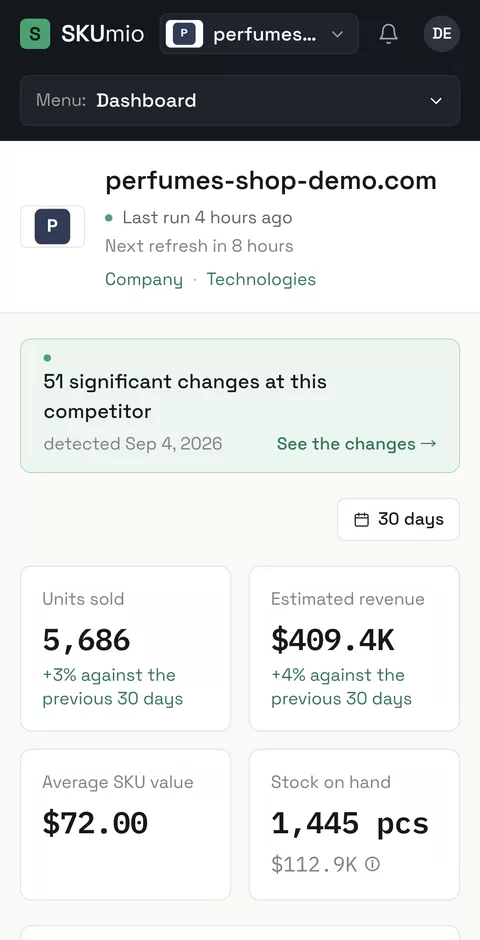
Dashboard - units sold, revenue and stock on hand
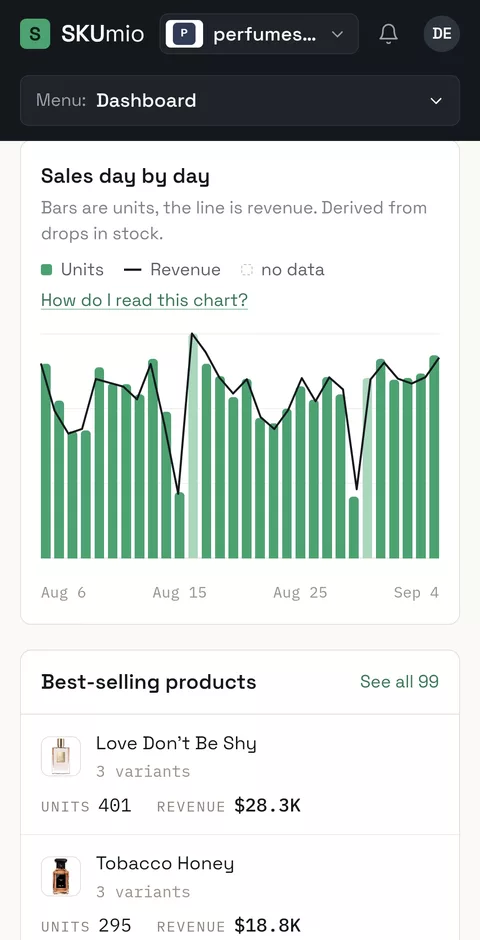
Sales day by day, worked out from drops in stock
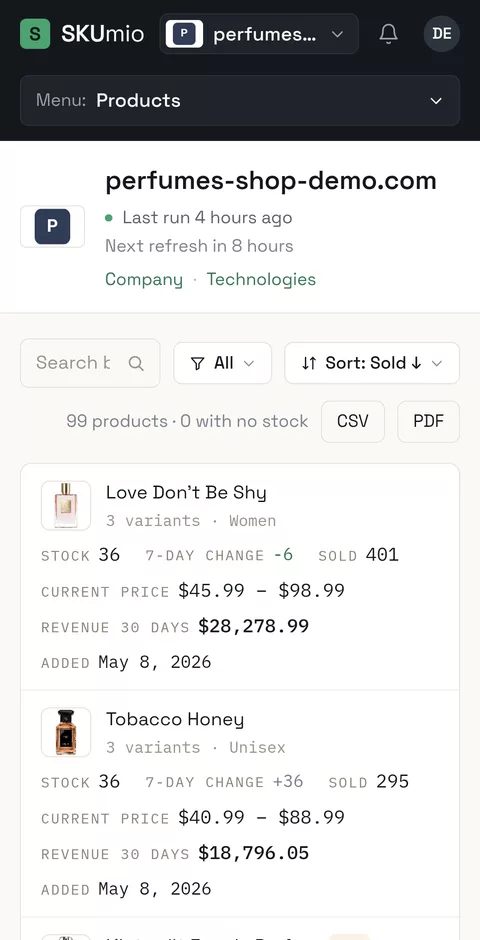
Every product with its stock, price and sales
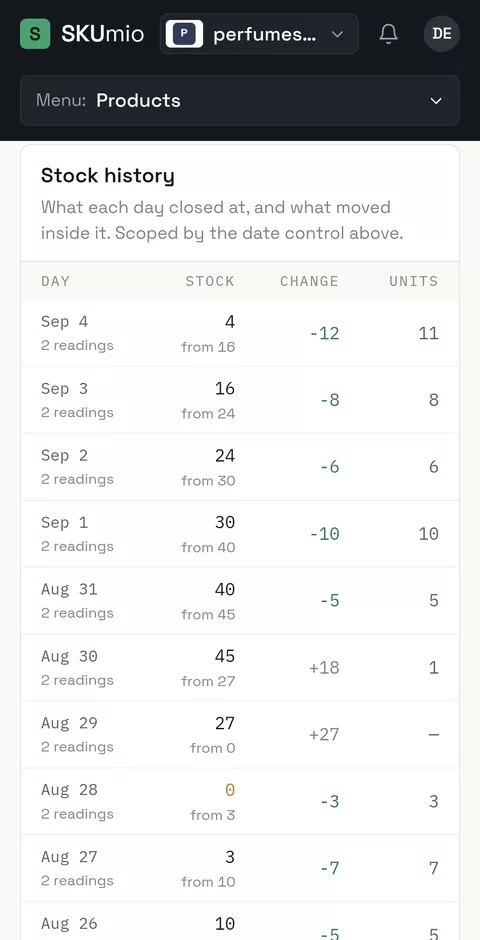
Stock history of one product, day by day
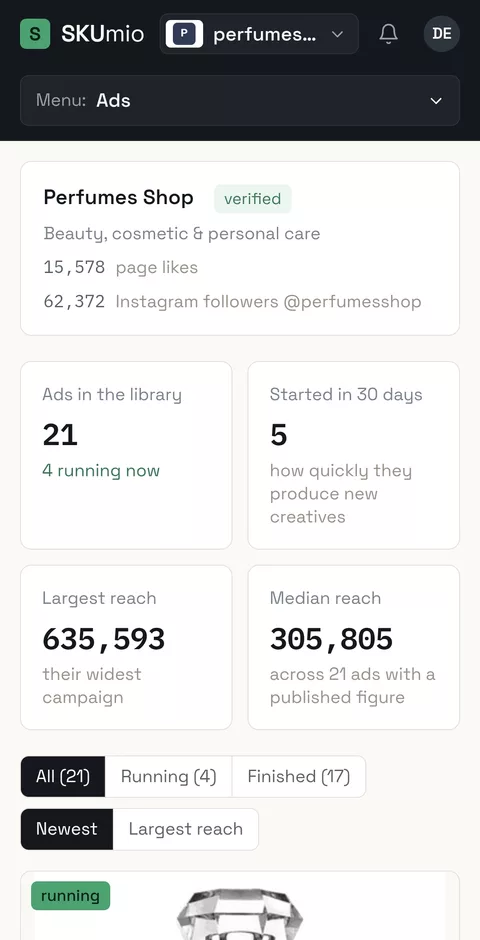
The competitor's ads and how far they reach
SKUmio runs in a browser and as a phone app.
Shops we checked recently
Press any of them and we will check it while you watch. Free, in a minute.
Three steps, no integration
You just give us an address
We detect the platform, count the products and confirm that we can read this shop's stock. You see the price after you have the proof that it works, and before anything is charged.
We read the stock
Every 2 to 12 hours we read the whole catalogue and the stock behind it, steadily and in order. The more often we read, the more precisely you can see what sold on which day.
A drop is a sale
Stock fell from 84 to 79: that is five units sold. Multiply by that day's price and you have revenue. A large rise in stock is a restock and a small one is usually a return; neither is a negative sale, so neither subtracts from the figure.
Three different questions, one set of numbers
The same stock data answers three questions that three different people in a company keep asking.
“How much do they really sell?”
A competitor's sales day by day, in units and in revenue. You can tell whether a weak week was the market or your shop alone.
- Daily units and estimated revenue
- Their best sellers and the products that do not move
- Compared with the previous period
“What do we order for next season?”
A buyer does not have to guess. They can see which products and which sizes are selling elsewhere before placing their own order.
- Size report - which sizes sell out first
- Shortages and variants out of stock for weeks
- Their restocks - what arrives and when
“Why is it selling?”
Alongside the number of units sold we show the likely reason: the advertising they are running right now, the newsletters they send, their search rankings and every price change.
- Creatives from the Meta, Google and TikTok libraries, and the newsletters they send
- Search visibility and the keywords they are gaining
- Price changes lined up against that day's sales
Eight views from one stock check
Everything below comes from the same stock levels. None of it needs an integration, a plugin, or any involvement from the shop being monitored.
Sales
A day-by-day table of units and revenue. Click a day to see exactly what sold that day.
Products
Every product and every variant separately: how many sold, how many are left, at what price. New arrivals and recently sold-out items come first.
Reports
Sizes, shortages, category value, restocks and price changes. Each one downloadable as CSV or PDF.
Physical stores*
Sales broken down by store - a figure normally only their own head office has.
Ads and newsletters
Creatives from the Meta, Google and TikTok libraries, and the competitor's newsletters: what they say, since when, to whom and with what reach.
Search traffic
Visibility, keywords and sessions, plus what the competitor gained or lost since the last measurement.
Runs
The history of every check: when, how many products, by which method, and whether the result is trustworthy.
Events
One stream across every shop you monitor: sell-outs, restocks, new campaigns, sharp changes in visibility.
* The per-store breakdown only works for chains that publish stock for each location. The check states plainly whether this particular shop does.
Two example shops with their full stock and sales history, in the real panel. No sign-up, no card.
Figures only your competitor and their accountant have seen
Market intelligence tools estimate revenue from website traffic. We read stock levels instead, which shows things traffic never can.
Units, not an estimate from traffic
The rest of the market guesses revenue from visitor counts and an average order value. We count the units that left their stock and multiply by that day's price.
The advertising, set beside the result
You see the campaigns a competitor is running right now and the sales from those same days. That is how you tell whether a campaign changed anything.
Sales store by store*
For chains that publish stock per location, we split sales across individual cities. You learn which of their stores the result is coming from.
Which size sells out first
Stock per variant means you can see that size 38 sold out in four days while size 44 has been in stock since March without selling. That is a ready-made buying list.
When their stock arrives
A clear rise in stock is a restock, as opposed to a single unit reappearing, which is usually a return. You see a competitor's delivery rhythm and what they reorder more of after a good season.
Price against sales
We record every price change next to the same day's sales. You can tell whether a discount increased sales or only reduced the margin.
You pay per day of monitoring, not a monthly subscription
The price follows three things: how large the catalogue is, how often we read it, and how hard the data is to get out of the shop. You are billed only for successful runs.
per day of watching a shop of up to 200 products - 2 reads every 12 hours.
| Products in the catalogue | every 12 hours | every 8 hours | every 4 hours | every 2 hours |
|---|---|---|---|---|
| up to 200 | $0.30 $9 / 30 days | $0.45 $14 / 30 days | $0.90 $27 / 30 days | $1.80 $54 / 30 days |
| 201 - 1,000 | $0.60 $18 / 30 days | $0.90 $27 / 30 days | $1.80 $54 / 30 days | $3.60 $108 / 30 days |
| 1,001 - 5,000 | $1.20 $36 / 30 days | $1.80 $54 / 30 days | $3.60 $108 / 30 days | $7.20 $216 / 30 days |
| 5,001 - 20,000 | $2.40 $72 / 30 days | $3.60 $108 / 30 days | $7.20 $216 / 30 days | $14.40 $432 / 30 days |
The number we price on is however many items the shop itself lists. In most shops that is products. In some, every size and colour is a separate item, which can be several times more than the product count you would read off their menu.
Full price list, up to a million products and beyond
These are starting prices, and they depend on how hard the stock is to read. You get the exact price for a specific address in 60 seconds, by clicking the button below. Several customers can watch one shop at the same time; if you would rather its data reached nobody else, exclusivity costs 99 USD a month.
See the proof that it works! For free.
Just type a competitor's address and see within a minute whether we can read its stock, how large its catalogue is and what monitoring it would cost per day. You pay only once monitoring starts, and only for the days on which a check succeeded.
Questions we are asked
Will the shop notice it is being monitored?
We read at a few requests a second, spread over time - less traffic than one active customer generates. Most shops publish their current stock levels openly. We do not sign in, we do not place orders, we do not break into anything, and we read nothing beyond publicly available pages.
How do you know it is a sale and not a stock correction?
A drop in stock is a candidate for a sale, not proof of one. A run in which more than a quarter of the variants fall to zero at once is discarded entirely. A zero that stock later recovers from - 10, then 0, then 8 - is treated as a bad reading rather than as ten sales. And when a shop changes platform, we break the history at that point instead of recording its entire stock as sold.
How long until the first numbers?
The catalogue, prices and stock appear within 10 minutes to 3 hours of adding the shop, depending on its size. Sales come from the difference between two readings, so the first sales figure arrives after the next run.
How many shops can I monitor at once?
As many as you need - each billed separately, per day of monitoring. Events from all of them collect in a single stream.
Can somebody else monitor the same shop?
By default yes, and that is why the price is what it is: we read the shop once and share the cost between everybody monitoring it. You can reverse that. Exclusivity costs 99 USD a month, and while you hold it nobody else on SKUmio can monitor that shop or see reports about it. There is one condition: nobody else may be monitoring it already. You can buy it while adding the shop, or later in its settings, and give it up whenever you like.
Check a competitor before you pay anything
Type an address. Within a minute we will prove that we can read its stock levels and work out its daily sales.
The check is free, with no account to create and no card to enter.